
Are you asking yourself, “what is web analytics?” Web analytics is a way of collecting and analyzing what’s happening on your website. It can cover everything from what your visitors are doing, where they come from, what content they like, and a whole lot more.
By using a web analytics tool to collect data, you’ll be able to know what is and isn’t working, and then steer your website in the right direction.
👉 In this article, we’re going to answer the question, “what is web analytics?” in more detail and talk about why it’s important. We’ll also discuss some web analytics tools that provide different insights. Finally, we’ll show you 😎 six analytics metrics you need to start tracking right away. Let’s talk numbers!
What is web analytics? 📈 Plus why analytics matter
There is a lot of data you can collect about how people interact with your website. For example, you can track overall visits, the pages users spend the most time on, which sites led them to your site, and more:

If you’re new to web analytics, the sheer amount of available information can be overwhelming, let alone figuring out what to do with it. However, making sense of this data is essential because it will enable you to keep a finger on your site’s pulse.
Let’s take ‘time on site’, for example. This metric measures how long users spend on your site on average and on each page individually. Generally speaking, if visitors are only spending a few seconds on your website before leaving, there’s something wrong with it.
If you’re wondering, users spend around three minutes ⌚ on most websites on average [1].
👉 Later on, we will introduce you to some key metrics you need to keep an eye on and why they’re important. For now, let’s explore some web analytics tools.
Web analytics tools
There are plenty of different web analytics tools and platforms at your disposal. Below we’ll go through a quick rundown of four popular options to help you get started!
It’s important to note that all of the web analytics tools we’ll cover are designed to work with WordPress. If your website, blog, or ecommerce store was built using some other CMS or platform, then you can skip this section and go straight to how to start collecting web analytics.
Google Site Kit

Google Site Kit is a comprehensive plugin that incorporates Google Analytics, Search Console, AdSense, PageSpeed Insights, and Tag Manager. With this tool, you can monitor everything from your website’s visitors to page loading speed and performance in the search results.
Since Google Site Kit pulls data directly from Google Analytics, you’ll be able to track user data like conversion events, demographics, and acquisition sources. Additionally, you can set goals such as purchases, clicks on buttons, and form entries.
Key features:
- Access Google Analytics data from your WordPress dashboard.
- Monitor metrics for your full site and individual posts.
- Receive updates on progress toward your website goals.
Pricing: Site Kit is completely free.
Burst Statistics

Burst Statistics markets itself as a privacy-friendly alternative to Google Analytics. It uses cookieless tracking to collect user behavior data without storing information within user browsers or identifying visitors’ personal information.
Moreover, Burst Statistics collects a variety of data points, including time on page, visitor referrers, and page views. You can even configure the plugin to collect and display custom metrics.
Key features:
- Collect user data without infringing on visitor privacy.
- Monitor referrers, pageviews, sessions, pages, and time on page.
- Create custom metrics and view them in your dashboard.
Pricing: Burst Statistics is free.
Matomo Analytics

Matomo Analytics is another popular web analytics tool. Like Burst Statistics, Matomo puts a strong emphasis on user privacy. As such, it includes features like local data hosting instead of third-party information storage.
Matomo collects various data points, including user behavior, e-commerce conversions, and keywords. Furthermore, the platform develops visitor heatmaps, creates graphs and other visual data, and segments your reports according to custom parameters.
Key features:
- Integrate Matomo with your chosen e-commerce solution, such as WooCommerce, Easy Digital Downloads, or MemberPress.
- Learn essential visitor insights without violating privacy or using data sampling.
- Configure more than 200 parameters to create custom reports.
Pricing: Matomo has a free plugin. Premium plans start at €19 per month and include data storage on Matomo servers, additional reports, and white labeling.
Independent Analytics
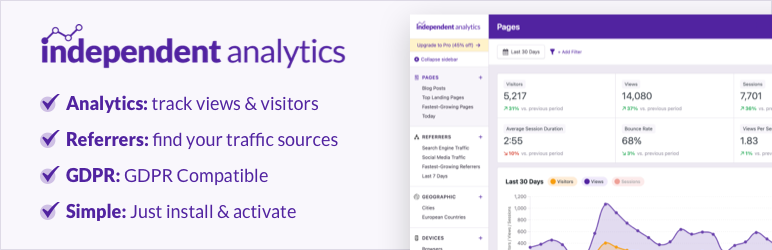
Independent Analytics is another great web analytics tool with privacy-conscious features. It’s fully GDPR-compliant while providing a wealth of visitor data. Plus, you can see multiple information levels, from quick statistic overviews to in-depth analyses of every page on your site.
Moreover, Independent Analytics provides a variety of information, from top traffic sources to visitor demographics. You can view all of this data in both numerical and visual formats to better inform your website strategies.
Key features:
- Filter analytics according to page type, date ranges, and user type.
- View granular analytics data for every page on your website, along with more general overviews.
- Access an interactive geodata map to learn more about your visitors’ origins.
Pricing: Independent Analytics has a free plugin. The Pro tool costs $54 per year and allows you to track campaigns, access analytics in real time, receive priority customer support, and more.
How to start collecting web analytics 🏁
If your site is part of the 43.2% of websites on the internet who’ve been built with WordPress, then you can follow our guide on how to set up Google Analytics in WordPress to get started. You can also use the first plugin mentioned on the list above, or another plugin such as Google Analytics WD.
If you’ve used some other platform to build your site – don’t worry! You’re welcome here too. You can still set up Google Analytics. In fact, that’s one of the main reasons we chose it for this next section:
Because it can be used almost universally on all websites and it is easily the most popular web analytics tool available. Not to mention that it is completely free and gives you access to all the metrics you’ll need to monitor your site.
Once you get Google Analytics set up, you can read 🎁 our beginner’s guide to the Google Analytics interface to get your bearings. When you have the basics down, you might also want to look 👨💻 into creating your own custom dashboards to quickly access important analytics data.
And now, without further ado, we will begin exploring how to use this platform to monitor six key web analytics that you should be tracking.
6 key web analytics you should be tracking 📊
There are a lot of web metrics you can track using analytics tools. However, the six data points below are great places to start. Once you understand these, you’ll probably never ask “what is web analytics?” again. Let’s begin with general visitor numbers.
- Overall traffic
- Bounce rate
- Traffic sources
- Desktop vs. mobile visits
- New and returning visitors
- Exit pages
1. Overall traffic
When we talk about web traffic, we refer to the number of visits your site gets over a specific period. This number is significant because it tells you if your website is getting the attention it deserves:

Let’s say you’re getting about 50 visitors per day. That’s a low number if your website has been around for a year. However, it’s decent if you set up shop a month ago. In other words, not only is it important to keep an eye on your traffic, but also the way it evolves.
Ideally, your numbers will go up as your website grows. If your traffic stagnates or diminishes over time, it’s a marker you’re not doing something right. In most cases, it might be due to Search Engine Optimization (SEO) issues, so that’s always a good place to start.
2. Bounce rate
When someone visits your site and leaves without viewing a second page, we call that a ‘bounce’. The percentage of user visits measured against your overall traffic makes up your bounce rate:

This metric is important because it tells you if there are any outstanding usability issues with your website. Some of the most common causes for a high bounce rate include:
- Long loading times
- A clunky navigation system
- An unattractive web design
The average bounce rate for most websites is anywhere between 41 and 55 percent (lower is better) [2]. However, as a rule of thumb, if your bounce rate is higher than 30 percent, you’ll want to look closely at the possible causes we mentioned above.
However, bounce rate is highly dependent on what content your site provides and what searchers are looking for. So, it’s not always a bad thing if you’re above that number.
3. Traffic sources
In most cases, first-time visitors will find your website via links instead of typing in your URL. The pages that link to your site are your traffic sources, and we can usually break them down into four categories:
- Search engines
- Links from other sites
- Visits from email campaigns
- Links from social media
Generally speaking, you want to build up all four sources of traffic. However, your primary focus will usually be search engines because they have the potential to bring in massive traffic numbers. More importantly, if your website ranks consistently high in search results, you can get links from other sites more easily because they’ll consider you a reputable source.
With web analytics tools, you can easily monitor your traffic sources and adjust your strategy accordingly. For example, if you don’t see much traffic from search engines, you should consider revising your keyword strategy.
4. Desktop vs. mobile visits
It might not surprise you to learn that mobile traffic is now fully adopted by many web users. In fact, it overtook regular desktop traffic a while ago, making it essential for your website to offer a strong mobile experience [3].
With analytics tools, you can track what percentage of users are visiting your site through desktop or mobile browsers. It’s a simple enough metric to interpret, and it tells you where to focus your efforts:

Even if your website is getting more desktop than mobile traffic, we still recommend focusing on optimizing its mobile experience. Adopting a mobile-first approach to web design will pay off in the long run.
5. New and returning visitors
Ideally, you want people to keep coming back to your website over and over again. We call those users ‘return visitors’ (and they’re the best!), but you can also consider them your core audience.
Many people have different ideas about what constitutes a decent returning user rate. In our experience, if your recurring traffic is anywhere around 30 percent of your total, you’re doing pretty well.
However, if it’s below 20 percent, your website isn’t as engaging as it could be. This might be due to usability issues – such as those affecting your bounce rate – or your content strategy. In any case, it’s grounds for taking a close look at your site and figuring out how you can improve it.
6. Exit pages
Users won’t stay on your website forever. However, there are likely common parts of your site where visitors choose to leave. These are referred to as ‘exit pages’, and they can give you a lot of insight into your website’s structure and content.
Monitoring exit pages is beneficial if your website has multi-step conversion processes. For example, you might have multi-page checkouts, surveys, or signup forms:

If your conversion pages are too long and complicated, visitors might choose to leave rather than complete the purchase or signup process. Therefore, you’ll want to reduce user friction and increase visitor engagement as much as possible on your exit pages.
There are various ways to address friction, such as streamlining your checkout process and asking for minimal details from your customers. You might also consider utilizing exit intent pop-ups to catch your visitors as they try to leave your website.
Web analytics FAQ
We hope that by now you understand the answer to “what is web analytics”, but before we wrap it up here, we wanted to share a quick rundown of some of the most frequently asked questions related to this topic. If you were skimming the article or if there is something you only wanted a quick answer to, then hopefully you’ll find it below.
Simply put, web analytics refers to certain sets of data that a website owner can use to track the performance of their website.
Web analytics is important because without it, it’s impossible to make data-backed decisions. You might have a gut feeling that your site visitors like a particular piece of content that you wrote, but what if the website data says otherwise? Without access to web metrics that tell you what your website visitors are doing on your website, you won’t truly know how effective your content strategy has been, and whether or not you need to make adjustments.
The two main categories of web analytics are on-site analytics and off-site analytics.
On-site web analytics provide data about how visitors to your website interact with it, and what content they find engaging. This helps you understand how effective your content strategy and marketing campaigns have been. The information comes directly from your site – hence “on-site”.
In contrast, off-site analytics data does not come directly from your site – hence “off-site”. Off-site data allows you to see the size of your potential audience and how well your website is doing when stacked up against your competitors. When most people think of the term “web analytics” they are thinking about on-site analytics and that is what we focused on in this article.
There are many, but six very common ones are overall traffic, bounce rate, sources of traffic, desktop versus mobile visits, new versus returning visitors, and exit pages (which are the specific pages that people leave your site from).
First, you’ll need a free Google Analytics account. Then you’ll need to connect that account to your website. To do this, you will need to locate the unique tracking code found inside your Google Analytics account. It starts with UA followed by a string of numbers. You will then copy and paste it into your theme’s files. If you are using WordPress, then it’s probably safer to use a plugin like OrbitFox. It’s free and connects your Google Analytics account to your WordPress site without having to deal with code.
First, create a new Google Analytics 4 property.
Next, get your GA4 tracking code.
Finally, add the tracking code to your website.
For the detailed version, please see our full guide on how to set up Google Analytics 4 on your website.
The easiest way to check if a site is tracking their web analytics using Google Analytics is by using a free tool called GA Checker. If you are using Google Chrome, you can also manually check it by doing the following:
First, right click on the page and choose “View page source” from the menu.
Next, press Ctrl+F (PC) or command+F (MAC) to search for a Google Analytics tracking code.
The final step is where it gets a bit tricky, because it depends on which version of Google Analytics might be present on any given website. If a site is using Google Analytics 4 or Universal Analytics (the predecessor to GA4), then searching gtag.js will show up in the source code. If a website is really old and hasn’t been touched in a long time, then you can also try searching for analytics.js and see if it comes up.
Final thoughts on web analytics 🧐
A lot of people run their sites without keeping an eye on their web metrics. That approach might work. However, since you have so many great web analytics tools at your disposal (such as Google Analytics), it’s a waste if you don’t use them. For example, keeping an eye on your traffic alone can tell you if your content strategy is paying off (or if you need to try something new).
There are a lot of numbers you should pay attention to when it comes to web analytics. However, below you’ll find six of the most important metrics you should keep an eye on. If you’re able to grasp these, then you will have a fundamental answer to the question “what is web analytics?”.
- Overall traffic 🚦
- Bounce rate 💹
- Traffic sources 🚧
- Desktop 🖥️ vs. mobile visits 📱
- New and returning visitors 🏃
- Exit pages 📑
Hopefully this article answered “what is web analytics” for you, but if you still have questions, please ask away in the comments section below!


Or start the conversation in our Facebook group for WordPress professionals. Find answers, share tips, and get help from other WordPress experts. Join now (it’s free)!